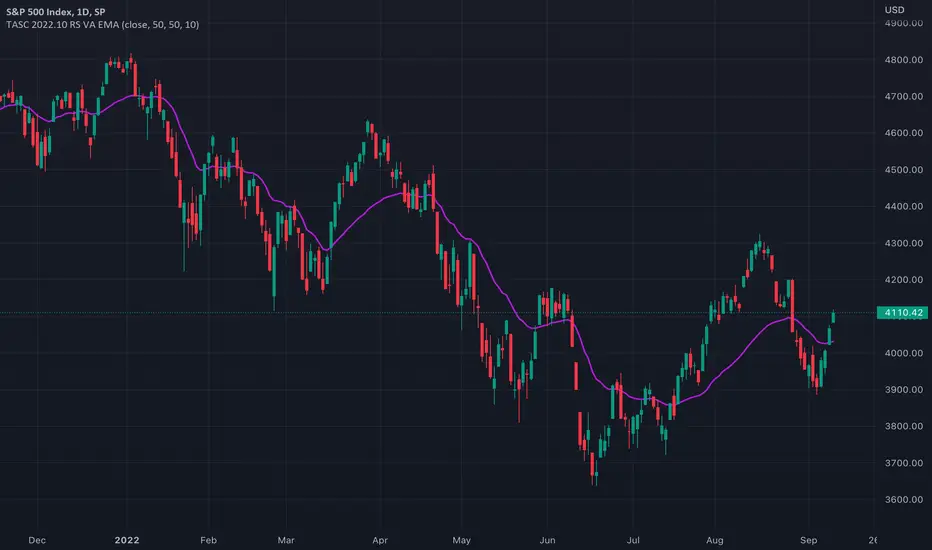
TASC 2022.10 RS VA EMA█ OVERVIEW
TASC's October 2022 edition Traders' Tips includes the second part of the "Relative Strength Moving Averages" article series authored by Vitali Apirine. This is the code that implements the Relative Strength Volume-Adjusted Exponential Moving Average (RS VA EMA) presented in this publication.
█ CONCEPTS
In his article series, the author argues that the relative strength of price, volume, and volatility can potentially be used to filter price movements and define turning points. In particular, the RS VA EMA indicator is designed to account for the relative strength of volume. Like the traditional exponential moving average (EMA) , it is a lagging trend-following indicator. The difference is that it responds more quickly.
In a trading strategy, RS VA EMA is suggested to be used in combination with EMA of the same length to determine the overall trend or in combination with RS VA EMA of a different length to identify turning points and filter price movements.
█ CALCULATIONS
The calculation of RS VA EMA is based on the concept of volume strength (VS). By definition, VS measures the difference between "positive" and "negative" volume flow. Volume is indicated as "positive" when the close is higher than the previous close and "negative" when the close is below the previous close.
The following steps are used in the calculation process:
• Calculate the volume strength (VS) of a given length.
• Multiply VS by a predefined multiplier and calculate the EMA of the resulting time series.
The values of 10,10,10 are the typical input settings for RS VA EMA, where the first parameter is the length of the moving average, the second is the length of VS, and the third is the volume strength multiplier.
חפש סקריפטים עבור "Exponential Moving Average"
PPO w/ Discontinued Signal Lines [Loxx]PPO w/ Discontinued Signal Lines is a Percentage Price Oscillator with some upgrades. This indicator has 33 source types and 35+ moving average types as well as Discontinued Signal Lines and divergences. These additions reduce noise and increase hit rate.
What is the Price Percentage Oscillator?
The percentage price oscillator (PPO) is a technical momentum indicator that shows the relationship between two moving averages in percentage terms. The moving averages are a 26-period and 12-period exponential moving average (EMA).
The PPO is used to compare asset performance and volatility, spot divergence that could lead to price reversals, generate trade signals, and help confirm trend direction.
Included:
Bar coloring
3 signal variations w/ alerts
Divergences w/ alerts
Loxx's Expanded Source Types
Loxx's Moving Averages

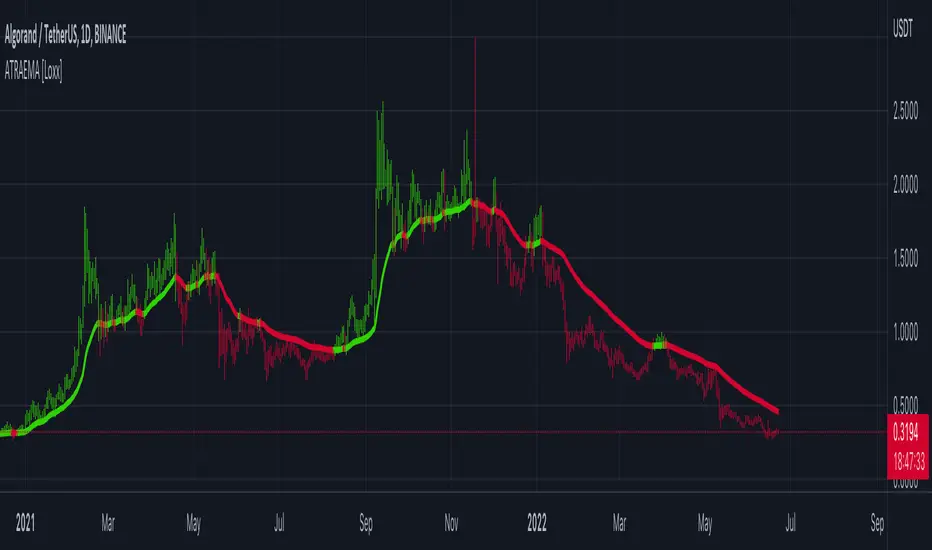
ATR Adaptive EMA [Loxx]ATR adaptive EMA is an exponential moving average with dynamic ATR-adjusted length inputs.
What is Average True Range (ATR)?
The average true range (ATR) is a technical analysis indicator, introduced by market technician J. Welles Wilder Jr. in his book New Concepts in Technical Trading Systems, that measures market volatility by decomposing the entire range of an asset price for that period.1
The true range is taken as the greatest of the following: current high less the current low; the absolute value of the current high less the previous close; and the absolute value of the current low less the previous close. The ATR is then a moving average, generally using 14 days, of the true ranges.
StapleIndicatorsLibrary "StapleIndicators"
This Library provides some common indicators commonly referenced from other studies in Pine Script
squeeze(bbSrc, bbPeriod, bbDev, kcSrc, kcPeriod, kcATR, signalPeriod) Volatility Squeeze
Parameters:
bbSrc : (Optional) Bollinger Bands Source. By default close
bbPeriod : (Optional) Bollinger Bands Period. By default 20
bbDev : (Optional) Bollinger Bands Standard Deviation. By default 2.0
kcSrc : (Optional) Keltner Channel Source. By default close
kcPeriod : (Optional) Keltner Channel Period. By default 20
kcATR : (Optional) Keltner Channel ATR Multiplier. By default 1.5
signalPeriod : (Optional) Keltner Channel ATR Multiplier. By default 1.5
Returns:
adx(diPeriod, adxPeriod, signalPeriod, adxTier1, adxTier2, adxTier3) ADX: Average Directional Index
Parameters:
diPeriod : (Optional) Directional Indicator Period. By default 14
adxPeriod : (Optional) ADX Smoothing. By default 14
signalPeriod : (Optional) Signal Period. By default 13
adxTier1 : (Optional) ADX Tier #1 Level. By default 20
adxTier2 : (Optional) ADX Tier #2 Level. By default 15
adxTier3 : (Optional) ADX Tier #3 Level. By default 10
Returns:
smaPreset(srcMa) Delivers a set of frequently used Simple Moving Averages
Parameters:
srcMa : (Optional) MA Source. By default 'close'
Returns:
emaPreset(srcMa) Delivers a set of frequently used Exponential Moving Averages
Parameters:
srcMa : (Optional) MA Source. By default 'close'
Returns:
maSelect(ma, srcMa) Filters and outputs the selected MA
Parameters:
ma : (Optional) MA text. By default 'Ema-21'
srcMa : (Optional) MA Source. By default 'close'
Returns: maSelected
periodAdapt(modeAdaptative, src, maxLen, minLen) Adaptative Period
Parameters:
modeAdaptative : (Optional) Adaptative Mode. By default 'Average'
src : (Optional) Source. By default 'close'
maxLen : (Optional) Max Period. By default '60'
minLen : (Optional) Min Period. By default '4'
Returns: periodAdaptative
azlema(modeAdaptative, srcMa) Azlema: Adaptative Zero-Lag Ema
Parameters:
modeAdaptative : (Optional) Adaptative Mode. By default 'Average'
srcMa : (Optional) MA Source. By default 'close'
Returns: azlema
ssma(lsmaVar, srcMa, periodMa) SSMA: Smooth Simple MA
Parameters:
lsmaVar : Linear Regression Curve.
srcMa : (Optional) MA Source. By default 'close'
periodMa : (Optional) MA Period. By default '13'
Returns: ssma
jvf(srcMa, periodMa) Jurik Volatility Factor
Parameters:
srcMa : (Optional) MA Source. By default 'close'
periodMa : (Optional) MA Period. By default '7'
Returns:
jBands(srcMa, periodMa) Jurik Bands
Parameters:
srcMa : (Optional) MA Source. By default 'close'
periodMa : (Optional) MA Period. By default '7'
Returns:
jma(srcMa, periodMa, phase) Jurik MA (JMA)
Parameters:
srcMa : (Optional) MA Source. By default 'close'
periodMa : (Optional) MA Period. By default '7'
phase : (Optional) Phase. By default '50'
Returns: jma
maCustom(ma, srcMa, periodMa, lrOffset, almaOffset, almaSigma, jmaPhase, azlemaMode) Creates a custom Moving Average
Parameters:
ma : (Optional) MA text. By default 'Ema'
srcMa : (Optional) MA Source. By default 'close'
periodMa : (Optional) MA Period. By default '13'
lrOffset : (Optional) Linear Regression Offset. By default '0'
almaOffset : (Optional) Alma Offset. By default '0.85'
almaSigma : (Optional) Alma Sigma. By default '6'
jmaPhase : (Optional) JMA Phase. By default '50'
azlemaMode : (Optional) Azlema Adaptative Mode. By default 'Average'
Returns: maTF

Ichimoku VariationsThe Ichimoku cloud is traditionally constructed from the highest high and lowest low for a number of periods. This script allows for it to be transformed and calculated like more traditional moving averages (e.g. simple moving average, exponential moving average). Since the Ichimoku is normally a system of moving average-like lines, maybe someone out there will learn something from being able to switch to sma, ema, etc etc.
In general, I think no TA indicator is a magic bullet, and you should just use what you like!
Credit: This script utilizes the "Color Gradient Framework" tutorial by LucF (PineCoders) to create gradient visuals, which are also customizable for the user.
Recommended modes:
default
SMA
EMA
SMMA
WMA
VWMA
Tillson T3
Not Recommended (These moving averages are too fast, and probably will require adjusting settings to something like the 20-60-120-30 to make more sense):
HMA
EHMA
TEMA
ALMA
LSMA

T3 + BB
TRES EMAS + BANDAS DE BOLLINGER
INDICADOR 1: TRES EMAS (MEDIA MOVIL EXPONENCIAL)
Con este indicador puede visualizar el promedio de precios con mayor peso a los datos mas recientes.
Se calculan y dibujan tres medias móviles exponenciales: 4, 20 y 200 últimas velas.
-Rápida EMA1 = 4, paso = 1
-Media EMA2 = 20, paso = 2
-Lenta EMA 3 = 200, paso = 10
INDICADOR 2: BANDAS DE BOLLINGER
Con este indicador podrá ver la fuerza y la tendencia del mercado, es decir la mide la volatilidad del precio del activo.
Si el precio sobrepasa la banda superior, el activo está sobrecomprado.
Si el precio sobrepasa la banda inferior, el activo está sobrevendido.
Longitud tendencia - BASE = 20, paso = 1
Desviación Estándar - Multiplicador = 2, paso = 0.2
Estos 2 indicadores sirven para todo tipo de activos: FOREX, CRIPTO, CFD´s, ETC.
------------------------------------------------------------------------------------------------------------------
THREE EMAS + BOLLINGER BANDS
INDICATOR 1: THREE EMAS (EXPONENTIAL MOVING AVERAGE)
With this indicator you can visualize the average of prices with greater weight to the most recent data.
Three exponential moving averages are calculated and drawn: 4, 20 and 200 last candles.
-Fast EMA1 = 4, step = 1
-Average EMA2 = 20, step = 2
-Slow EMA 3 = 200, step = 10
INDICATOR 2: BOLLINGER BANDS
With this indicator you can see the strength and trend of the market, that is, it is measured by the volatility of the asset price.
If the price goes above the upper band, the asset is overbought.
If the price goes above the lower band, the asset is oversold.
Trend length - BASE = 20, step = 1
Standard Deviation - Multiplier = 2, step = 0.2
These 2 indicators are used for all types of assets: FOREX, CRYPT, CFD's, ETC.

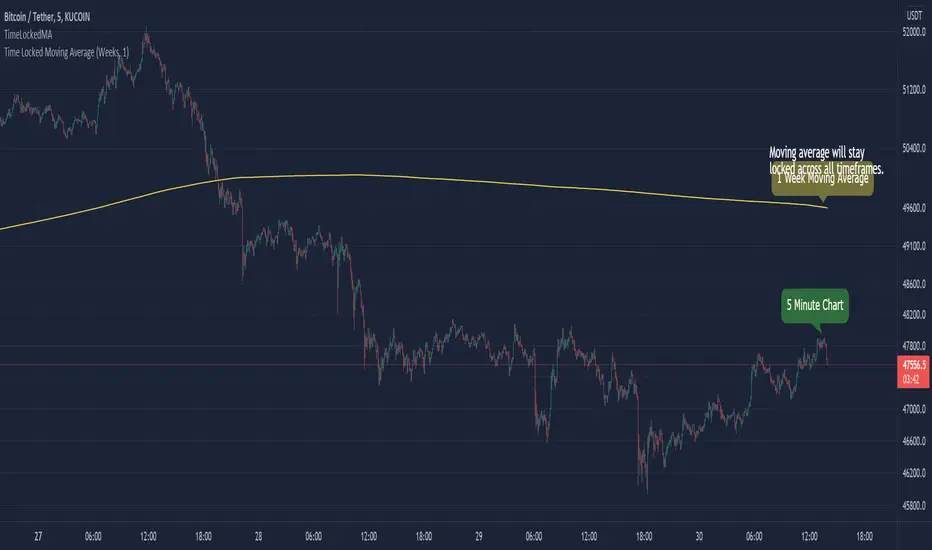
TimeLockedMALibrary "TimeLockedMA"
Library & function(s) which generates a moving average that stays locked to users desired time preference.
TODO - Add functionality for more moving average types. IE: smooth, weighted etc...
Example:
time_locked_ma(close, length=1, timeframe='days', type='ema')
Will generate a 1 day exponential moving average that will stay consistent across all chart intervals.
Error Handling
On small time frames with large moving averages (IE: 1min chart with a 50 week moving average), you'll get a study error that says "(function "sma") references too many candles in history" .
To fix this, make sure you have timeframe="" as an indicator() header. Next, in the indicator settings, increase the timeframe from to a higher interval until the error goes away.
By default, it's set to "Chart". Bringing the interval up to 1hr will usually solve the issue.
Furthermore, adding timeframe_gaps=false to your indicator() header will give you an approximation of real-time values.
Misc Info
For time_lock_ma() setting type='na' will return the relative length value that adjusts dynamically to user's chart time interval.
This is good for plugging into other functions where a lookback or length is required. (IE: Bollinger Bands)
time_locked_ma(source, length, timeframe, type) Creates a moving average that is locked to a desired timeframe
Parameters:
source : float, Moving average source
length : int, Moving average length
timeframe : string, Desired timeframe. Use: "minutes", "hours", "days", "weeks", "months", "chart"
type : string, string Moving average type. Use "SMA" (default) or "EMA". Value of "NA" will return relative lookback length.
Returns: moving average that is locked to desired timeframe.
timeframe_convert(t, a, b) Converts timeframe to desired timeframe. From a --> b
Parameters:
t : int, Time interval
a : string, Time period
b : string, Time period to convert to
Returns: Converted timeframe value
chart_time(timeframe_period, timeframe_multiplier) Separates timeframe.period function and returns chart interval and period
Parameters:
timeframe_period : string, timeframe.period
timeframe_multiplier : int, timeframe.multiplier
Enjoy :)
Swing Dream - PAINT BARS | MA | EMA | DMA | VWAP | TABLE | ADR %- Swing Dream -
Script created for breakout-swing traders, in the style of QullaMaggie * , Dan Zanger, Oliver Kell, and Stockbee.
The following indicators are used by most successful breakout-swing traders such as mentioned above.
(As published) it contains:
Painted Bars, also known as inside/outside candles. Used for candle analysis and to determine breakout pivots & levels. For instance; use it in different timeframes and seek formations (ex, 3-1-2). For further inspiration, study Rob Smith's The Strat .
MA, Simple Moving Averages (Basic levels = 10,20,50,200). Use this indicator to define resistance/support areas as well as the overall long/swing-term trend. In breakout strategies such as EP, Flags, etc this can be used for trailing stops; an example, post-breakout, let the price ride the 20ma before exiting your position.
EMA, Exponential Moving Averages with periods inspired by Qullamaggie (10,20,65). Use this on shorter timeframes (ex, 1h) and for the same principles as MAs.
VWAP, Volume-Weighted Average Price. As for the previous, utilize this as a level indicator to find areas of resistance/support. Good for swing-trading as it implies whenever holders are profitable or not.
DMA, Displaced Moving Average (Horizontal). Personally, I use this a lot. Works very well for trailing stops (post breakout) and "bounce" areas. Choose your own offset and period.
ADR%, Average Daily Range Percentage. Displayed in the table and used to define a symbol's volatility. A very good tool for Qullamaggie-style trading. Personally, I try to find setups with over 6% ADR. Basic definition; low ADR% = Increased chance of a symbol to move slower and in smaller ranges. A higher value equals the opposite.
Table. A table with basic symbol-related information. Could save you plenty of time whenever you scan or search for new swing setups. Looking to add more features here.
Why should you use this script? Well, instead of having tens of different indicators, use this script and combine everything together with EP, Flag, or breakout principles. Suited for every plan, and more efficient in my opinion.
View settings to turn on/off different indicators.
* If you're looking for an introduction and further explanation of how Qullamaggie uses mentioned indicators, I could recommend checking out his website, stream, or participation in "Chat With Traders".
At last, I want to credit: @jkcqld @neolao @TheScrutiniser
This Script will get updated and improved.
// TechFille006

3 Moving Average Exponential with multi TFThis is a simple Exponential Moving Average indicator. It allows you to have 3 Exponential Moving Averages and set a specific TimeFrame for each. Feel free to cope code LOL!

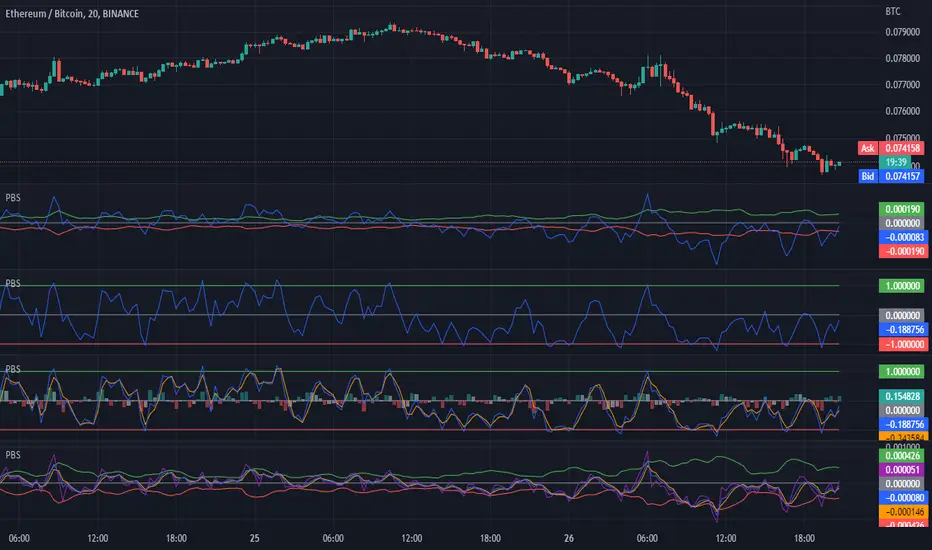
H/L Price Band with Signal Line (PBS)This indicator centers a moving average around the hl2 of the price. This is calculated as the difference of two moving averages. The upper band is a 9 period exponential moving average, the lower band is a 7 period moving average and the center line is the average between the two. The "Fast Line" is our signal line in this oscillator. When the price is hovering around the center of the band this indicates that a trend is pausing or reversing. When the fast line exits the band this could be a buy or sell signal. It could also indicate a very strong trend in that direction. To get the optimal entry and exit you might want to wait for the price to return to the center line. In addition to the basic functionality of this indicator I have added some bonus features. You can enable the "Slow Line" or the "Long Line" to enhance your signals. When the fast line is above the slow/long line you are in an up trend and inversely when the fast line is below the slow/long line you are in a down trend. The crossing of these lines can indicate a reversal. I have also included a "J" style amplification line. This works by enhancing the difference between the Fast and Slow/Long line to make it more visually apparent. You can also configure the "J" line to be calculated between either the slow or long line. Finally I have added the feature to amplify the band width by the standard deviation. This is set to 1 by default but you can also get a more responsive signal by setting this to 0.
This indicator works in most markets. There is a tool tip for every aspect of this indicator explaining how everything works. I hope you are very profitable with this one!
If you find this indicator is useful to you, Star it, Follow, Donate, Like and Share.
Your support is a highly motivation for me.
Indicator Functions with Factor and HeikinAshiHello all,
This indicator returns below selected indicators values with entered parameters.
Also you can add factorization, functions candles, function HeikinAshi and more to the plot.
VERSION:
Version 1: returns series only source and Length with already defined default values
Version 2: returns series with source, Length, p1 and p2 parameters according to the indicator definition (ex: )
PARAMETERS p1 p2
for defining multi arguments (See indicators list) indicator input value usable with verison=V2 selected.. ex: for alma( src , len ,offset=0.85,sigma=6), set source=source, len=length, p1=0.85 an p2=6
FACTOR:
Add double triple, Quadruple factors to selected indicator (like converting EMA to 2-DEMA, 3-TEMA, 4-QEMA...)
1-Original
2-Double
3-Triple
4-Quadruple
LOG
Log: Use log, log10 on function entries
PLOTTING:
PType: Plotting type of the function on the screen
Original :use original values
Org. Range (-1,1): usable for indicators between range -1 and 1
Stochastic: Convert indicator values by using stochastic calculation between -1 & 1. (use AT/% length to better view)
PercentRank: Convert indicator values by using Percent Rank calculation between -1 & 1. (use AT/% length to better view)
ST/%: length for plotting Type for stochastic and Percent Rank options
Smooth: Use SWMA for smoothing the function
DISPLAY TYPES
Plot Candles: Display the selected indicator as candle by implementing values
Plot Ind: Display result of indicator with selected source
HeikinAshi: Display Selected indicator candles with Heikin Ashi calculation
INDICATOR LIST:
hide = 'DONT DISPLAY', //Dont display & calculate the indicator. (For my framework usage)
alma = 'alma( src , len ,offset=0.85,sigma=6)', // Arnaud Legoux Moving Average
ama = 'ama( src , len ,fast=14,slow=100)', //Adjusted Moving Average
acdst = 'accdist()', // Accumulation/distribution index.
cma = 'cma( src , len )', //Corrective Moving average
dema = 'dema( src , len )', // Double EMA (Same as EMA with 2 factor)
ema = 'ema( src , len )', // Exponential Moving Average
gmma = 'gmma( src , len )', //Geometric Mean Moving Average
hghst = 'highest( src , len )', //Highest value for a given number of bars back.
hl2ma = 'hl2ma( src , len )', //higest lowest moving average
hma = 'hma( src , len )', // Hull Moving Average .
lgAdt = 'lagAdapt( src , len ,perclen=5,fperc=50)', //Ehler's Adaptive Laguerre filter
lgAdV = 'lagAdaptV( src , len ,perclen=5,fperc=50)', //Ehler's Adaptive Laguerre filter variation
lguer = 'laguerre( src , len )', //Ehler's Laguerre filter
lsrcp = 'lesrcp( src , len )', //lowest exponential esrcpanding moving line
lexp = 'lexp( src , len )', //lowest exponential expanding moving line
linrg = 'linreg( src , len ,loffset=1)', // Linear regression
lowst = 'lowest( src , len )', //Lovest value for a given number of bars back.
pcnl = 'percntl( src , len )', //percentile nearest rank. Calculates percentile using method of Nearest Rank.
pcnli = 'percntli( src , len )', //percentile linear interpolation. Calculates percentile using method of linear interpolation between the two nearest ranks.
rema = 'rema( src , len )', //Range EMA (REMA)
rma = 'rma( src , len )', //Moving average used in RSI . It is the exponentially weighted moving average with alpha = 1 / length.
sma = 'sma( src , len )', // Smoothed Moving Average
smma = 'smma( src , len )', // Smoothed Moving Average
supr2 = 'super2( src , len )', //Ehler's super smoother, 2 pole
supr3 = 'super3( src , len )', //Ehler's super smoother, 3 pole
strnd = 'supertrend( src , len ,period=3)', //Supertrend indicator
swma = 'swma( src , len )', //Sine-Weighted Moving Average
tema = 'tema( src , len )', // Triple EMA (Same as EMA with 3 factor)
tma = 'tma( src , len )', //Triangular Moving Average
vida = 'vida( src , len )', // Variable Index Dynamic Average
vwma = 'vwma( src , len )', // Volume Weigted Moving Average
wma = 'wma( src , len )', //Weigted Moving Average
angle = 'angle( src , len )', //angle of the series (Use its Input as another indicator output)
atr = 'atr( src , len )', // average true range . RMA of true range.
bbr = 'bbr( src , len ,mult=1)', // bollinger %%
bbw = 'bbw( src , len ,mult=2)', // Bollinger Bands Width . The Bollinger Band Width is the difference between the upper and the lower Bollinger Bands divided by the middle band.
cci = 'cci( src , len )', // commodity channel index
cctbb = 'cctbbo( src , len )', // CCT Bollinger Band Oscilator
chng = 'change( src , len )', //Difference between current value and previous, source - source.
cmo = 'cmo( src , len )', // Chande Momentum Oscillator . Calculates the difference between the sum of recent gains and the sum of recent losses and then divides the result by the sum of all price movement over the same period.
cog = 'cog( src , len )', //The cog (center of gravity ) is an indicator based on statistics and the Fibonacci golden ratio.
cpcrv = 'copcurve( src , len )', // Coppock Curve. was originally developed by Edwin "Sedge" Coppock (Barron's Magazine, October 1962).
corrl = 'correl( src , len )', // Correlation coefficient . Describes the degree to which two series tend to deviate from their ta. sma values.
count = 'count( src , len )', //green avg - red avg
dev = 'dev( src , len )', //ta.dev() Measure of difference between the series and it's ta. sma
fall = 'falling( src , len )', //ta.falling() Test if the `source` series is now falling for `length` bars long. (Use its Input as another indicator output)
kcr = 'kcr( src , len ,mult=2)', // Keltner Channels Range
kcw = 'kcw( src , len ,mult=2)', //ta.kcw(). Keltner Channels Width. The Keltner Channels Width is the difference between the upper and the lower Keltner Channels divided by the middle channel.
macd = 'macd( src , len )', // macd
mfi = 'mfi( src , len )', // Money Flow Index
nvi = 'nvi()', // Negative Volume Index
obv = 'obv()', // On Balance Volume
pvi = 'pvi()', // Positive Volume Index
pvt = 'pvt()', // Price Volume Trend
rise = 'rising( src , len )', //ta.rising() Test if the `source` series is now rising for `length` bars long. (Use its Input as another indicator output)
roc = 'roc( src , len )', // Rate of Change
rsi = 'rsi( src , len )', // Relative strength Index
smosc = 'smi_osc( src , len ,fast=5, slow=34)', //smi Oscillator
smsig = 'smi_sig( src , len ,fast=5, slow=34)', //smi Signal
stdev = 'stdev( src , len )', //Standart deviation
trix = 'trix( src , len )' , //the rate of change of a triple exponentially smoothed moving average .
tsi = 'tsi( src , len )', //True Strength Index
vari = 'variance( src , len )', //ta.variance(). Variance is the expectation of the squared deviation of a series from its mean (ta. sma ), and it informally measures how far a set of numbers are spread out from their mean.
wilpc = 'willprc( src , len )', // Williams %R
wad = 'wad()', // Williams Accumulation/Distribution .
wvad = 'wvad()' //Williams Variable Accumulation/Distribution
I will update the indicator list when I will update the library
Thanks to tradingview, @RodrigoKazuma for their open source indicators

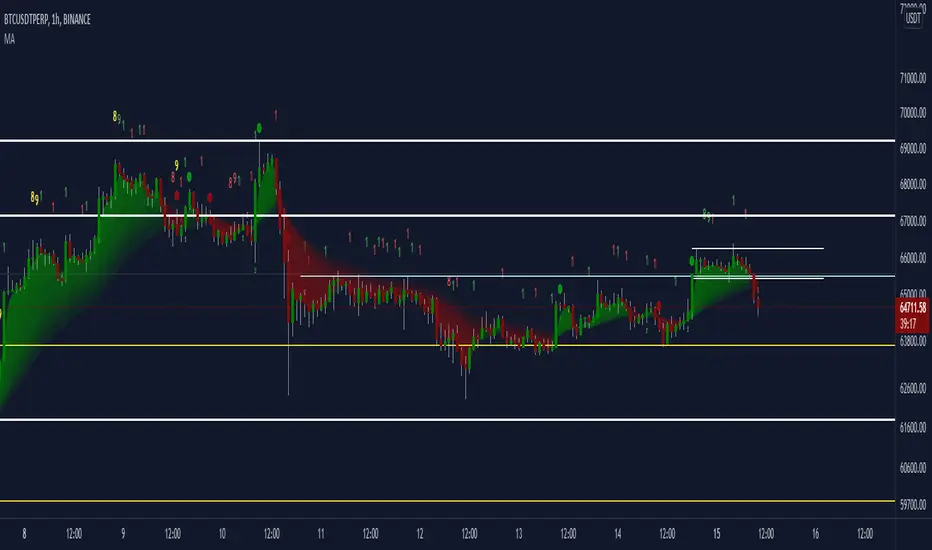
Moving Average Trend█ OVERVIEW
This is a Moving Average Script that contains both a cloud and a ribbon that has independent MA-type selection.
⬆ green arrow up = up trend flip
⬇ red arrow down = down trend flip
🟢 Green Dot = Potential Long
🔴 Red Dot = Potential Short
█ CONCEPTS
1 — Cloud, like most trading algo, the cloud is made of 8 short term MA , with MA cross and MA cross (longema)
2 — Ribbon, this is by default turned off, the default values , an option in setting to change longema to look for ribbon cross
3 — Sequence, It goes from 1 – 9 at 9 the sequence resets. The sequence changes colour depending on if it’s a down trend(red) or uptrend(green) or an over extended trend (yellow)
Setup definitions
Red sell start = current close < the close 4 candles back
Yellow sell extended = current close < last close and current close < two closes back
Green buy start = current close > the close 4 candles back
Yellow buy extended = current close last close and current close < two closes back
This can help you find when it’s time to get out, or sit out of a choppy trend.
4 - Moving Average types:
sma = Simple Moving Average
ema = Exponential Moving Average
wma = Weighted Moving Average
vwma = Volume Weighted Moving Average
rma = Running Moving Average
alma = Arnaud Legoux Moving Average
hma = Hull Moving Average
jma = Jurik Moving Average
frama-o = frama
frama-m = frama mod
dema = Double Exponential Moving Average
tema = Triple Exponential Moving Average
zlema = Zero lag Exponential Moving Average
smma = Smoothed Moving Average
kma = kaufman Moving Average
tma = triangular Moving Average
gmma = Geometric Mean Moving Average
vida = Variable Index Dynamic Average
cma = Corrective Moving average
rema = Range Exponential Moving average
█ OTHER SECTIONS
• FEATURES: to describe the detailed features of the script, usually arranged in the same order as users will find them in the script's inputs.
• HOW TO USE
• LIMITATIONS: Like with any MA script there is a lag factor associated with is.
• RAMBLINGS: Experiment to your hearts content with all the MA types, I'm impartial to HMA as is
• NOTES: some of the MA's are more taxing, therefore take longer to load, be patience, this is a trimmed down version of an existing invite only script i have
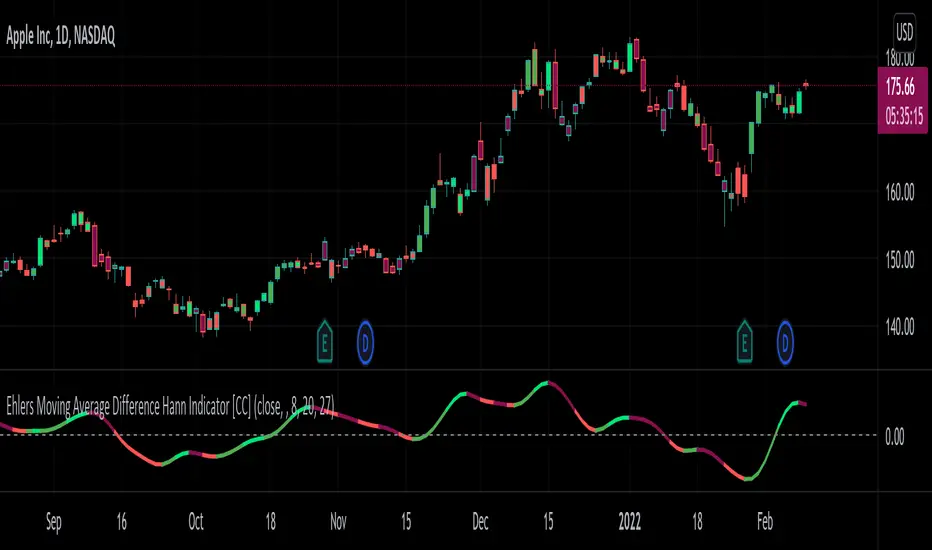
Ehlers Moving Average Difference Hann Indicator [CC]The Moving Average Difference Hann Indicator was created by John Ehlers (Stocks and Commodities Nov 2021) and this is an improved variation of his Moving Average Difference Indicator that uses smoothing from his Hann Windowing Indicator to provide smoother buy and sell signals. As for how this indicator works it is an improved version of the classic MACD indicator which of course takes a difference between two exponential moving averages. I have included strong buy and signals in addition to normal ones so lighter colors are normal signals and darker colors are strong signals. Buy when the line turns green and sell when it turns red.
Let me know if there are any other indicators you would like to see me publish!
Compound Moving Average [DM]Greetings Colleagues
We always have a problem with the type of moving average and how it is used, here are the two classics that I like the most "together".
I share a moving average composed of:
3 exponential moving averages
3 weighted moving averages
For the initial calculation, the weight has been distributed using the Williams Ultimate Oscillator ultimate oscillator technique but I have added an input to be able to balance the load

[blackcat] L1 Tim Tillson IE/2Level: 1
Background
Before this script, I cannot find a IE/2 moving average script in tradingview. Although it is not so complex, it is meaningful to be the 1st Tim Tilson IE/2 script in tradingview community. IE/2 moving average was disclosed in "Smoothin Techniques For More Accurate Signals", Tim Tilson, S&C Magazine, Traders Tips, 01/1998.
Function
IE/2 is one of pre-studies created while T3 famous average was developing. It is calculated as (ILRS(n)+EPMA(n))/2. ILRS, is an integral of linear regression slope. In this moving average, the slope of a linear regression line is simply integrated as it is fitted in a moving window of length n across the data. The derivative of ILRS is the linear regression slope.EPMA is an end point moving average - it is the endpoint of the linear regression line of length n as it is fitted across the data. EPMA hugs the data more closely than a simple or exponential moving average of the same length.
The most popular method of interpreting a moving average is to compare the relationship between a moving average of the security's price with the security's price itself (or between several moving averages).
Inputs
Price --> price data to use
Period --> number of bars to use in calculation
Key Signal
Price --> Price Input.
IE/2 --> IE/2 Ouput.
Remarks
This is a Level 1 free and open source indicator.
Feedbacks are appreciated.

Technical Ratings on Multi-frames / Assets█ OVERVIEW
This indicator is a modified version of TECHNICAL RATING v1.0 available in the public library to provide a quick overview of consolidated technical ratings performed on 12 assets in 3 timeframes.The purpose of the indicator is to provide a quick overview of the current status of the custom 12 (24) assets and to help focus on the appropriate asset.
█ MODIFICATIONS
- Markers, visualizations and alerts have been deleted
- Due to the limitation on maximum number of security (40), the results of 12 assets evaluated in 3 different time frames can be shown at the same time.
- An additional 12 assets can be configured in the settings so that you do not have to choose each ticker one by one to facilitate a quick change, but can switch between the 12 -12 assets with a single click on "Second sets?".
- The position, colors and parameters of the table can be widely customized in the settings.
- The 12 assets can be arranged in rows 3, 4, 6 and 12 with Table Rows options, which can also be used to create a simple mobile view.
- The default gradient color setting has been changed to red/yellow/green traffic lights
ORIGINAL DESCRIPTION ABOUT TECHNICAL RATING v1.0
█ OVERVIEW
This indicator calculates TradingView's well-known "Strong Buy", "Buy", "Neutral", "Sell" or "Strong Sell" states using the aggregate biases of 26 different technical indicators.
█ WARNING
This version is similar, but not identical, to our recently published "Technical Ratings" built-in, which reproduces our "Technicals" ratings displayed as a gauge in the right panel of charts, or in the "Rating" indicator available in the TradingView Screener. This is a fork and refactoring of the code base used in the "Technical Ratings" built-in. Its calculations will not always match those of the built-in, but it provides options not available in the built-in. Up to you to decide which one you prefer to use.
█ FEATURES
Differences with the built-in version
• The built-in version produces values matching the states displayed in the "Technicals" ratings gauge; this one does not always.
• A strategy version is also available as a built-in; this script is an indicator—not a strategy.
• This indicator will show a slightly different vertical scale, as it does not use a fixed scale like the built-in.
• This version allows control over repainting of the signal when you do not use a higher timeframe. Higher timeframe (HTF) information from this version does not repaint.
• You can adjust the weight of the Oscillators and MAs components of the rating here.
• You can configure markers on signal breaches of configurable levels, or on advances declines of the signal.
The indicator's settings allow you to:
• Choose the timeframe you want calculations to be made on.
• When not using a HTF, you can select a repainting or non-repainting signal.
• When using both MAs and Oscillators groups to calculate the rating, you can vary the weight of each group in the calculation. The default is 50/50.
Because the MAs group uses longer periods for some of its components, its value is not as jumpy as the Oscillators value.
Increasing the weight of the MAs group will thus have a calming effect on the signal.
• Alerts can be created on the indicator using the conditions configured to control the display of markers.
Display
The calculated rating is displayed as columns, but you can change the style in the inputs. The color of the signal can be one of three colors: bull, bear, or neutral. You can choose from a few presets, or check one and edit its color. The color is determined from the rating's value. Between 0.1 and -0.1 it is in the neutral color. Above/below 0.1/-0.1 it will appear in the bull/bear color. The intensity of the bull/bear color is determined by cumulative advances/declines in the rating. It is capped to 5, so there are five intensities for each of the bull/bear colors.
The "Strong Buy", "Buy", "Neutral", "Sell" or "Strong Sell" state of the last calculated value is displayed to the right of the last bar for each of the three groups: All, MAs and Oscillators. The first value always reflects your selection in the "Rating uses" field and is the one used to display the signal. A "Strong Buy" or "Strong Sell" state appears when the signal is above/below the 0.5/-0.5 level. A "Buy" or "Sell" state appears when the signal is above/below the 0.1/-0.1 level. The "Neutral" state appears when the signal is between 0.1 and -0.1 inclusively.
Five levels are always displayed: 0.5 and 0.1 in the bull color, zero in the neutral color, and -0.1 and - 0.5 in the bull color.
█ CALCULATIONS
The indicator calculates the aggregate value of two groups of indicators: moving averages and oscillators.
The "MAs" group is comprised of 15 different components:
• Six Simple Moving Averages of periods 10, 20, 30, 50, 100 and 200
• Six Exponential Moving Averages of the same periods
• A Hull Moving Average of period 9
• A Volume-weighed Moving Average of period 20
• Ichimoku
The "Oscillators" group includes 11 components:
• RSI
• Stochastic
• CCI
• ADX
• Awesome Oscillator
• Momentum
• MACD
• Stochastic RSI
• Wiliams %R
• Bull Bear Power
• Ultimate Oscillator

Bull vs Bear Power by DGTElder-Ray Bear and Bull Power
Dr. Alexander Elder cleverly named his first indicator Elder-Ray because of its function, which is designed to see through the market like an X-ray machine. Developed in 1989, the Elder-Ray indicator can be applied to the chart of any security and helps traders determine the strength of competing groups of bulls and bears by gazing under the surface of the markets for data that may not immediately be ascertainable from a superficial glance at prices
The Elder-Ray indicator is comprised by three elements – Bear Power, Bull Power and a 13-period Exponential Moving Average.
As the high price of any candle shows the maximum power of buyers and the low price of any candle shows the maximum power of sellers, Elder uses the 13-period EMA in order to present the average consensus of price value. Bull power shows whether buyers are capable of pushing prices above the average consensus of value. Bear power shows whether sellers are capable of pushing prices below the average consensus of value. Mathematically, Bull power is the result of subtracting the 13-period EMA from the high price of the day, and Bear power is the result of subtracting the 13-period EMA from the low price of the day.
What does this study implements
Attempts to customize interpretation of Alexander Elder's Elder-Ray Indicator (Bull and Bear Power) by
• adding additional insights to support/confirm Elder’s strategy with different indicators related with the Elder’s concept
• providing different options of visualization of the indicator
• providing smoothing capability
Other Indicators to support/confirm Elder-Ray Indicator:
Colored Directional Movement Index (CDMI) , a custom interpretation of J. Welles Wilder’s Directional Movement Index (DMI) , where :
DMI is a collection of three separate indicators ( ADX , +DI , -DI ) combined into one and measures the trend’s strength as well as its direction
CDMI is a custom interpretation of DMI which presents ( ADX , +DI , -DI ) with a color scale - representing the trend’s strength, color density - representing momentum/slope of the trend’s strength, and triangle up/down shapes - representing the trend’s direction. CDMI provides all the information in a single line with colored triangle shapes plotted on the top. DMI can provide quality information and even trading signals but it is not an easy indicator to master, whereus CDMI simplifies its usage.
Alexander Elder considers the slope of the EMA, which gives insight into the recent trend whether is up or down, and CDMI adds additional insight of verifying/confirming the trend as well as its strength
Note : educational content of how to read CDMI can be found in ideas section named as “Colored Directional Movement Index”
different usages of CDMI can be observed with studies “Candlestick Patterns in Context by DGT", “Ichimoku Colored SuperTrend + Colored DMI by DGT”, “Colored Directional Movement and Bollinger Band's Cloud by DGT”, and “Technical Analyst by DGT”
Price Convergence/Divergence , if we pay attention to mathematical formulations of bull power, bear power and price convergence/divergence (also can be expressed as price distance to its ma) we would clearly observe that price convergence/divergence is in fact the result of how the market performed based on the fact that we assume 13-period EMA is consensus of price value. Then, we may assume that the price convergence/divergence crosses of bull power, or bear power, or sum of bull and bear power could be considered as potential trading signals
Additionally, price convergence/divergence visualizes the belief that prices high above the moving average or low below it are likely to be remedied in the future by a reverse price movement
Alternatively, Least Squares Moving Average of Price Convergence/Divergence (also known as Linear Regression Curve) can be plotted instead of Price Convergence/Divergence which can be considered as a smoothed version of Price Convergence/Divergence
Note : different usages of Price Convergence/Divergence can be observed with studies “Trading Psychology - Fear & Greed Index by DGT”, “Price Distance to its MA by DGT”, “P-MACD by DGT”, where “Price Distance to its MA by DGT” can also be considered as educational content which includes an article of a research carried on the topic
Options of Visualization
Bull and Bear Power plotted as two separate
• histograms
• lines
• bands
Sum of Bull and Bear Power plotted as single
• histogram
• line
• band
Others
Price Convergence/Divergence displayed as Line
CDMI is displayed as single colored line of triangle shapes, where triangle shapes displays direction of the trend (triangle up represents bull and triangle down represent bear), colors of CDMI displays the strength of the trend (green – strong bullish, red – strong bearish, gray – no trend, yellow – week trend)
In general with this study, color densities also have a meaning and aims to displays if the value of the indicator is falling or growing, darker colors displays more intense move comparing to light one
Note : band's upper and lower levels are calculated by using standard deviation build-in function with multiply factor of 0.236 Fibonacci’s ratio (just a number for our case, no any meaning)
Smoothing
No smoothing is applied by default but the capability is added in case Price Convergence/Divergence Line is assumed to be used as a signal line it will be worth smoothing the bear, bull or sum of bear and bull power indicators
Interpreting Elder-Ray Indicator, according to Dr. Alexander Elder
Bull Power should remain positive in normal circumstances, while Bear Power should remain negative in normal circumstances. In case the Bull Power indicator enters into negative territory, this implies that sellers have overcome buyers and control the market. In case the Bear Power indicator enters into positive territory, this indicates that buyers have overcome sellers and control the market. A trader should not go long at times when the Bear Power indicator is positive and he/she should not go short at times when the Bull Power indicator is negative.
13-period EMAs slope can be used in order to identify the direction of the major trend. According to Elder, the most reliable buy signals are generated, when there is a bullish divergence between the Bear Power indicator and the price (Bear Power forms higher lows, while the market forms lower lows). The most reliable sell signals are generated, when there is a bearish divergence between the Bull Power indicator and the price (Bull Power forms lower highs, while the market forms higher highs).
There are four basic conditions, required to go long or short, with the use of the Elder-Ray method alone.
In order to go long:
1. The market is in a bull trend, as indicated by the 13-period EMA
2. Bear Power is in negative territory, but increasing
3. The most recent Bull Power top is higher than its prior top
4. Bear Power is going up from a bullish divergence
The last two conditions are optional that fine-tune the buying decision
In order to go short:
1. The market is in a bear trend, as indicated by the 13-period EMA
2. Bull Power is in positive territory, but falling
3. The most recent Bear Power bottom is lower than its prior bottom
4. Bull Power is falling from a bearish divergence
The last two conditions are optional, they provide a stronger signal for shorting but they are not absolutely essential
If a trader is willing to add to his/her position, he/she needs to:
1. add to his/her long position, when the Bear Power falls below zero and then climbs back into positive territory
2. add to his/her short position, when the Bull Power increases above zero and then drops back into negative territory.
note : terminology of the definitions used herein are as per TV dictionary
Trading success is all about following your trading strategy and the indicators should fit within your trading strategy, and not to be traded upon solely
Disclaimer : The script is for informational and educational purposes only. Use of the script does not constitute professional and/or financial advice. You alone have the sole responsibility of evaluating the script output and risks associated with the use of the script. In exchange for using the script, you agree not to hold dgtrd TradingView user liable for any possible claim for damages arising from any decision you make based on use of the script

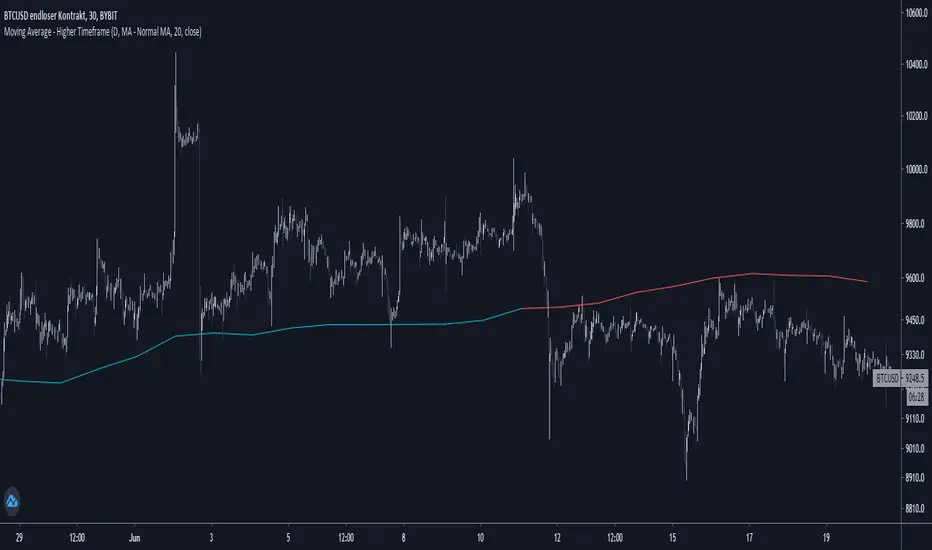
Moving Average - Higher TimeframeThis indicator let you choose between different Moving Average types while being able to adjust the plotted timeframe:
- Simple Moving Average
- Exponential Moving Average
- Weighted Moving Average
- Hull Moving Average
Set lengths according to your needs / your preferred moving average.
If you have any opinions or wishes feel free to contact me or simply leave a comment.
//@jnnkwnsch
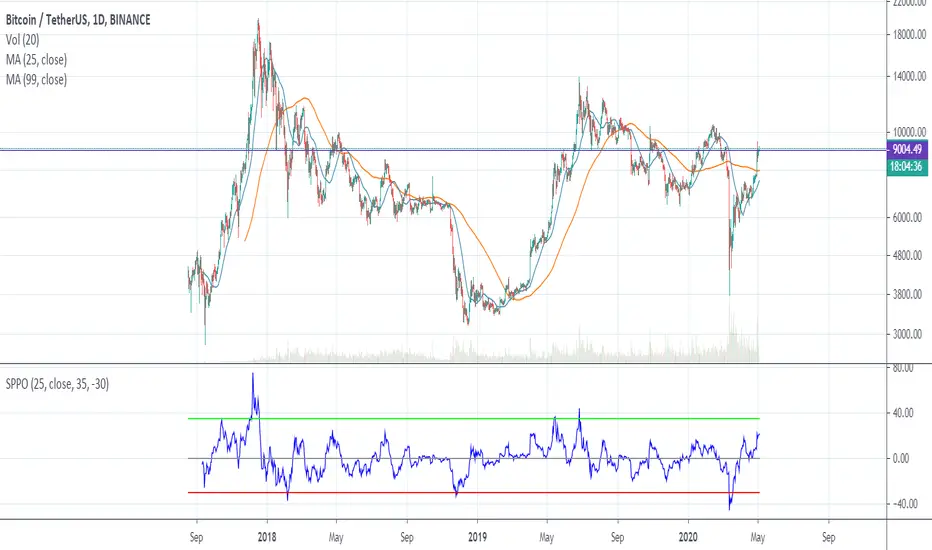
SPPO — Simple Percentage Price Oscillator SPPO is Simple Percentage Price Oscillator .
SPPO is calculated as the ratio of the current price to the moving average.
This indicator is used in the trading strategy to determine overbought and oversold markets. Chart period D1.
I use this oscillator on the BTCUSD and ETHUSD pairs. It can also be used on other top crypto symbols.
If SPPO on the BTCUSDT chart > 35%, this means that in the Bitcoin market pamp . So it’s time to close long positions.
If SPPO on the bitcoin chart is <-30%, then bitcoin is oversold and you need to think about starting to buy it.
Recommended timeframe: 1d
Input parameters:
MA Length — number of bars for moving average. Default = 25.
Source — type of price used to calculate the MA. Default = close.
High Level — upper horizontal constant on the SPPO chart. Default = 35.
Low Level — lower horizontal constant on the SPPO chart. Default = -35.
Simple MA(Oscillator) — type of MA indicator used. If false = Exponential Moving Average , if true = Simple Moving Average . Default = true.
Triple Moving AverageSimple indicator combining up to three moving averages. Uses simple moving average (SMA) and exponential moving average (EMA).

Multiple Moving AveragesThis is an indicator with 4 moving average slots and 6 exponential moving average slots
It also has bollinger bands and a volume weighted moving average slot
Feel free to edit this and add/remove some and publish your own
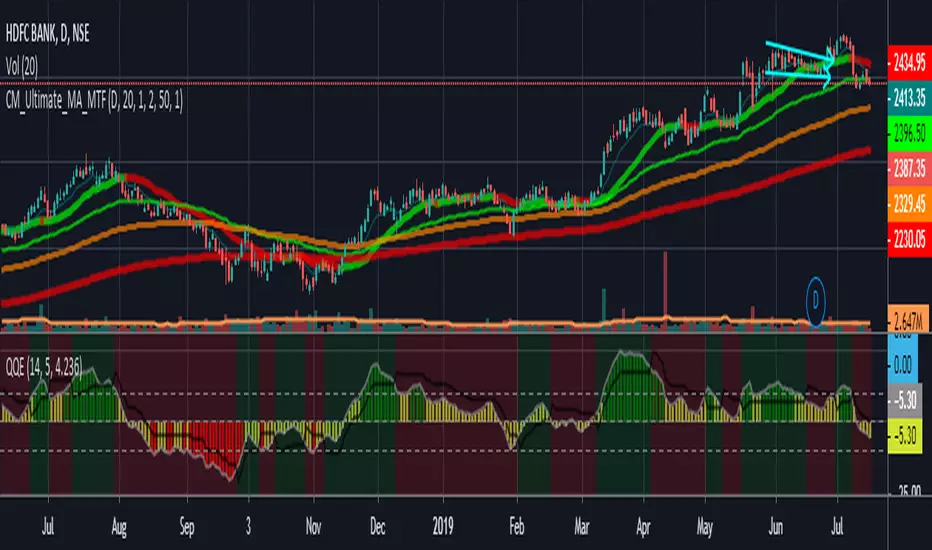
Ultimate_MA_MTF_CMChrisMoody MTF Ultimate Moving Average combined
with Exponential Moving Averages with Price line, i needed to analyze stocks
I have added 50, 100, 200 Period Moving Average to Chrismoody's UMA_MTF
Chris's MA can be found at
i have just combined these averages in a script major contribution goes to chris not me
please look at his indicator still is million times better than me
Multi-Bollinger [DW]This is an experimental study designed to visualize trend activity and volatility using a set of two Bollinger Bands calculated with a basis moving average type of your choice.
The available moving averages in this script are:
-Exponential Moving Average
-Simple Moving Average
-Weighted Moving Average
-Volume Weighted Moving Average
-Hull Moving Average
-Least Squares Moving Average
-Arnaud Legoux Moving Average
-Coefficient of Variation Weighted Moving Average
-Fractal Adaptive Moving Average
-Kaufman's Adaptive Moving Average
In addition, a middle filter is calculated by taking the median of the two basis lines.
Multi-Timeframe functionality is included. You can choose any timeframe that Tradingview supports as the basis resolution for the bands.
Custom bar color scheme is included with four options to choose from.
